Mob level distribution
Distributing mobs in a dungeon based on player’s level (or some dungeon level difficulty factor) was somewhat straightforward, but I would still like to document the progress. I needed to place a mob that’s somewhat within the difficulty level I want, plus minus a few difficulty levels to spice it up.
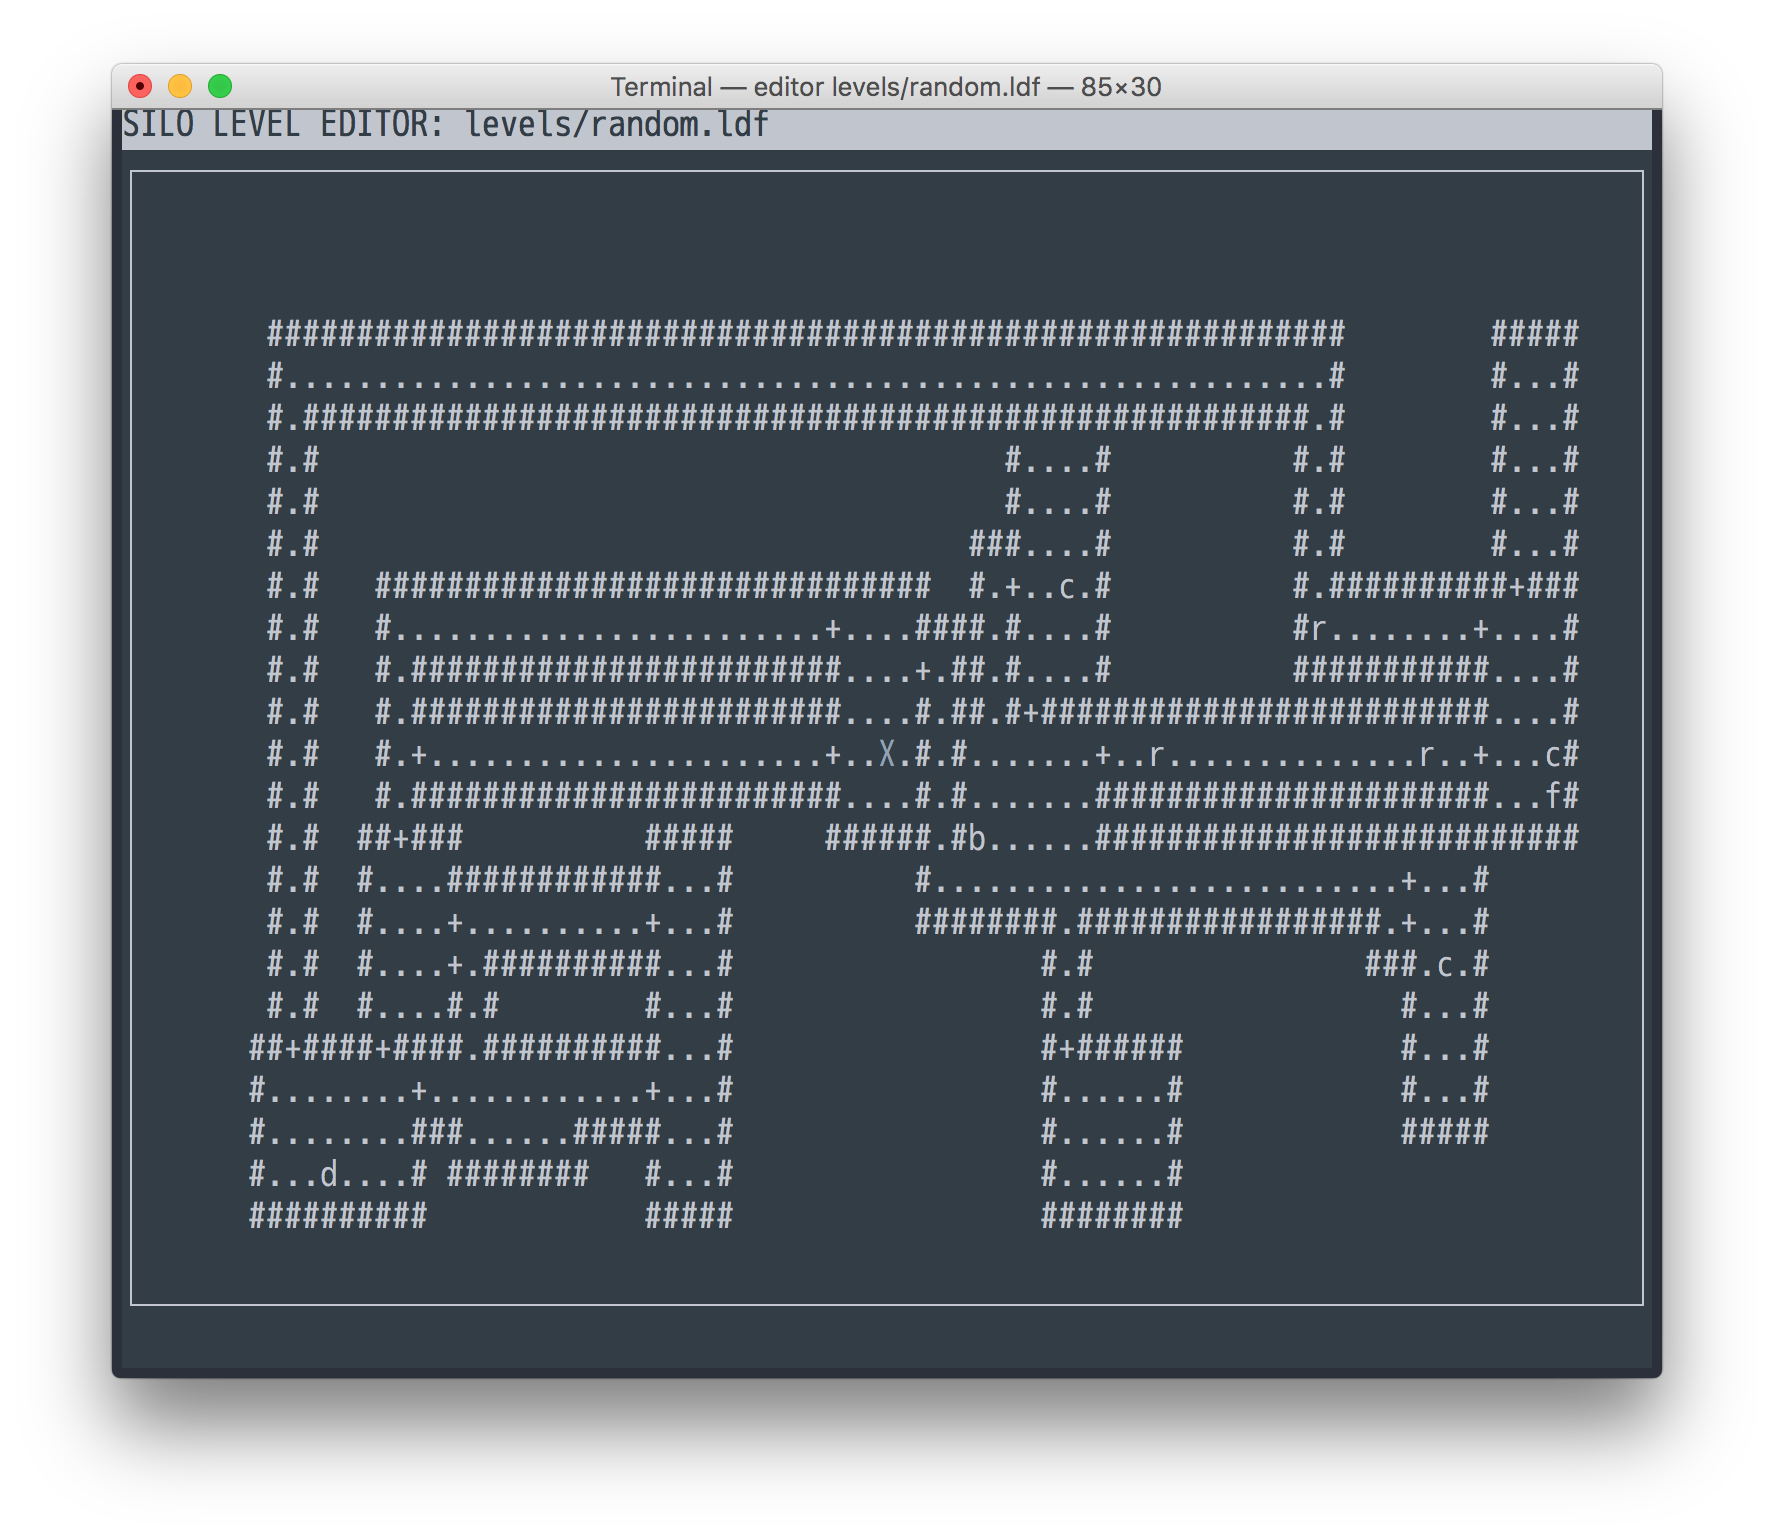
Above you can see three rats, three cats, a dog (r, c, d, all level 1), a
farmer (f, level 2), and a lonely bandit (b, level 3) in a level 1 dungeon.
Without going straight into measure theory, I generated intervals for each mob based on the diff of desired level and their level, and then randomly selected a point within the boundaries. Here’s the abstract code:
import bisect
import random


def get_random_element(data, target, chance):
    """Get random element from data set skewing towards target.

    Args:
        data   -- A dictionary with keys as elements and values as weights.
                  Duplicates are allowed.
        target -- Target weight, results will be skewed towards target
                  weight.
        chance -- A float 0..1, a factor by which chance of picking adjacent
                  elements decreases (i.e, with chance 0 we will always
                  select target element, with chance 0.5 probability of
                  selecting elements adjacent to target are halved with each
                  step).

    Returns:
        A random key from data with distribution respective of the target
        weight.
    """
    intervals = []  # We insert in order, no overlaps.
    next_i = 0
    for element, v in data.iteritems():
        d = max(target, v) - min(target, v)
        size = 100
        while d > 0:  # Decrease chunk size for each step of `d`.
            size *= chance
            d -= 1
        if size == 0:
            continue
        size = int(size)
        intervals.append((next_i, next_i + size, element))
        next_i += size + 1
    fst, _, _ = zip(*intervals)
    rnd = random.randint(0, next_i - 1)
    idx = bisect.bisect(fst, rnd)  # This part is O(log n).
    return intervals[idx - 1][2]
Now, if I test the above for, say, a 1000000 iterations, with a chance of 0.5 (halving probability of selecting adjacent elements with each step), and 2 as a target, here’s the distribution I end up with:
target, chance, iterations = 2, 0.5, 1000000

data = collections.OrderedDict([  # Ordered to make histogram prettier.
    ('A', 0), ('B-0', 1), ('B-1', 1), ('C', 2), ('D', 3), ('E', 4),
    ('F', 5), ('G', 6), ('H', 7), ('I', 8), ('J', 9),
])

res = collections.OrderedDict([(k, 0) for k, _ in data.iteritems()])

# This is just a test, so there's no need to optimize this for now.
for _ in xrange(iterations):
    res[get_random_element(data, target, chance)] += 1

pyplot.bar(
    range(len(res)), res.values(), width=0.7, align='center', color='green')
pyplot.xticks(range(len(res)), res.keys())
pyplot.title(
    'iterations={}, target={}, chance={}'.format(
        iterations, target, chance))
pyplot.show()
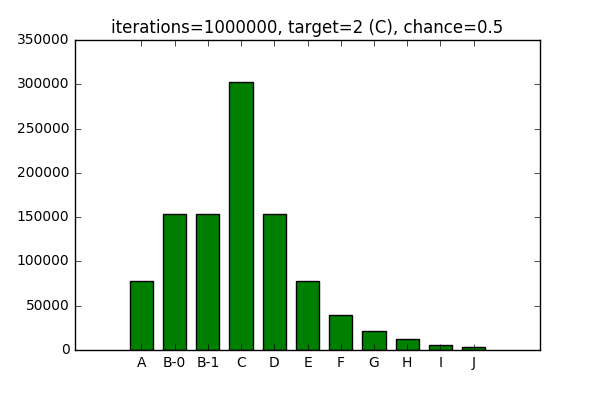
You can see elements B-0 and B-1 having roughly the same distribution, since they have the same weight.
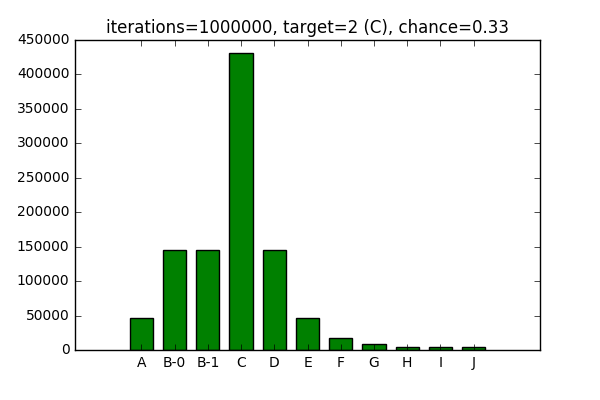
Now, if I decrease the chance, likelihood of target being selected increases,
while likelihood of surrounding elements being selected decreases:
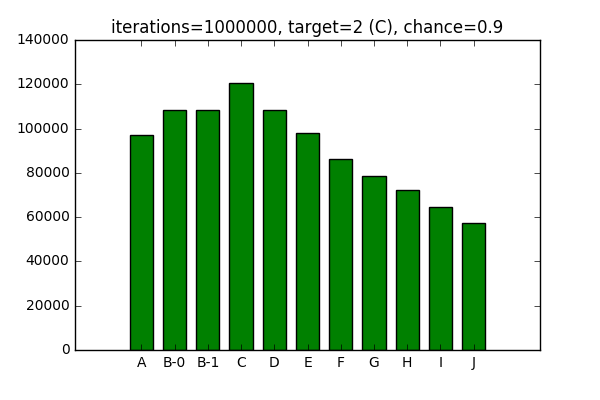
I works the opposite way as well, increasing the chance decreases likelihood
of the target being selected and increases the probability for surrounding
elements.
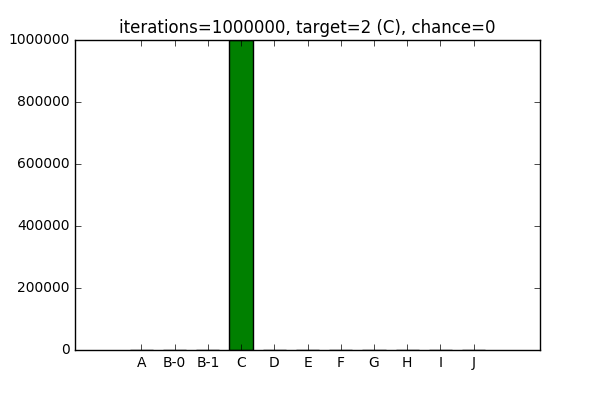
For the sake of completeness, it works with 0 chance of surrounding elements being picked:
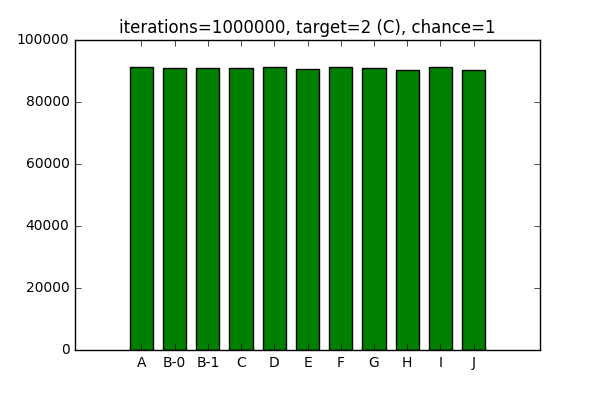
And an equal chance of picking surrounding elements:
After playing around with the configuration in Jupyter Notebook, I cleaned up the algorithm above and included it into mob placement routine.